Bearing, bypass, and why I still keep a hand-calc workbook open
Fastener load distribution is the classic place FE flatters you. Bearing-bypass, fastener flexibility, and why the spreadsheet still gets the last word.
A row of fasteners through two plates is about the most common thing in an airframe, and it gets mis-analysed constantly. The load each fastener picks up depends on the relative stiffness of the plates and the fasteners, and in a plain uniform splice the end fasteners almost always grab more than their share. Size the joint for the average and you’ve sized it for a load no single fastener actually sees.
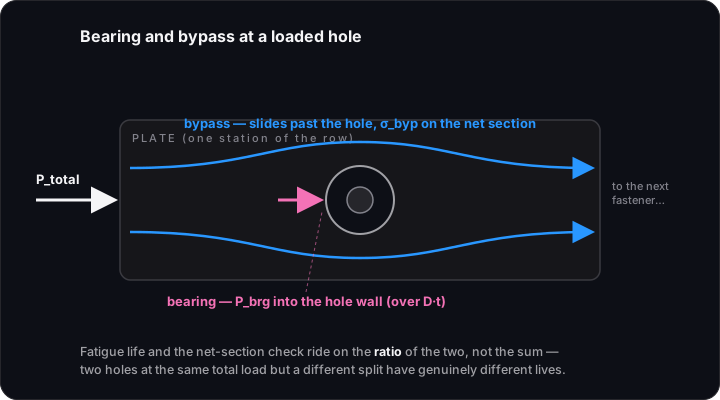
Two things happen at each hole at the same time, and you have to keep them separate in your head. There’s bearing, the load the fastener dumps into the hole wall, P_brg over the projected area D·t. And there’s bypass, the load that just slides past the hole on its way to the next fastener, σ_byp on the net section. The total through the plate at that station is the bypass plus whatever bearing hasn’t been transferred yet.
One station of the row: bearing into the hole wall, bypass past it. The split, not the sum, sets the local field.
The bit that catches people is that fatigue life and the net-section static check care about the ratio of those two, not the sum. A hole carrying mostly bypass behaves like a filled hole, Kt around 3. A hole carrying mostly bearing has a nastier local field, because the bearing load piles a tension peak at the hole edge on top of the bypass concentration. Two holes at the same total load but a different bearing-bypass split will have genuinely different lives. Which is exactly why a fatigue-critical fastened joint wants a bearing-bypass interaction diagram (bearing on one axis, bypass on the other, allowable a curve cutting across) and not a single margin number. A junior handed me a joint check once with one MS for the whole row and I had to send it back; the row average was fine and the end fastener was not.
Why is it uneven in the first place? Think of the splice as springs in parallel. Each fastener is a shear spring of stiffness 1/C_f, C_f being the fastener flexibility, and the plate segments between holes are axial springs. Load comes in one plate and leaves the other, and compatibility forces the outer fasteners to transfer more, because the plate strains haven’t equalised out there yet. The stiffer the plates relative to the fasteners, the worse it gets. And once you’re past about four fasteners in a line the middle ones basically loaf, so adding more buys you very little.
Now, the reason I don’t trust the first FE answer. A linear model with rigid fastener elements (a stiff CBUSH, a rigid RBE, whatever) will cheerfully hand you a distribution and it’ll be too even, because it’s ignoring fastener flexibility entirely. The fix is to give the connector a realistic shear flexibility from one of the empirical relations. Huth is my default for mixed joints, it covers metal and composite, single and double shear, bolts and rivets, with coefficients for the materials. Swift/Douglas are the older Boeing-lineage forms and they’re fine for aluminium-on-aluminium riveted work. And if your house method or the customer’s stress manual names a particular fit (some Boeing/Tate-Rosenfeld style thing), just use that one for consistency with the rest of the report, even if you’d personally pick differently. The flexibility scales roughly with 1/d and softens the joint so the end fasteners load up the way they do in test. Drop that number into the CBUSH and the FE distribution slides toward the hand calc.
My actual sequence, for what it’s worth:
Hand-calc the distribution first with a flexibility method, a spreadsheet of the spring model or the closed form for a uniform row. This is the answer I expect to get.
Build the FE with flexible fastener connectors. Not rigid ones.
Believe the FE only when it reproduces the hand calc to a sensible tolerance. When they disagree, the FE is usually wrong first, a missed flexibility, a fastener tied to the wrong nodes, a connection picking up bending it shouldn’t.
That workbook earns its place. It’s the independent answer that tells me whether the model is lying to me, and after years of this I’ve stopped giving the model the benefit of the doubt.
Last thing, because the simple model misses real load even when it’s done well. It’s a shear-only idealisation. A single-shear lap joint has eccentric load paths, so the offset puts bending into the plates and prying into the fastener, and that bending drags the fatigue-critical location to the faying surface at the end fastener. No in-plane spring sees it; you add it explicitly or you model the eccentricity. Clamp-up and friction carry some load before the joint ever bears, which helps fatigue but you generally don’t lean on it for static, sensibly. And fastener fit, clearance vs interference, cold-working, actual hole quality, those move fatigue life by factors not percentages and they live in the test data and the knockdowns, not in your linear FE.
So the FE distribution is where the joint analysis starts, not where it finishes. The flexibility method moves it toward reality, the hand calc tells you whether to believe it at all, and then you still owe the secondary bending a separate look, because that’s usually where the thing actually cracks and the in-plane model never saw it coming.
esc
✦
Ask my CV
Ask me anything about Berkay's CV, projects and skills.
Türkçe de sorabilirsiniz.